How to Read FAA Test Figures: Weight and Balance and Performance Charts
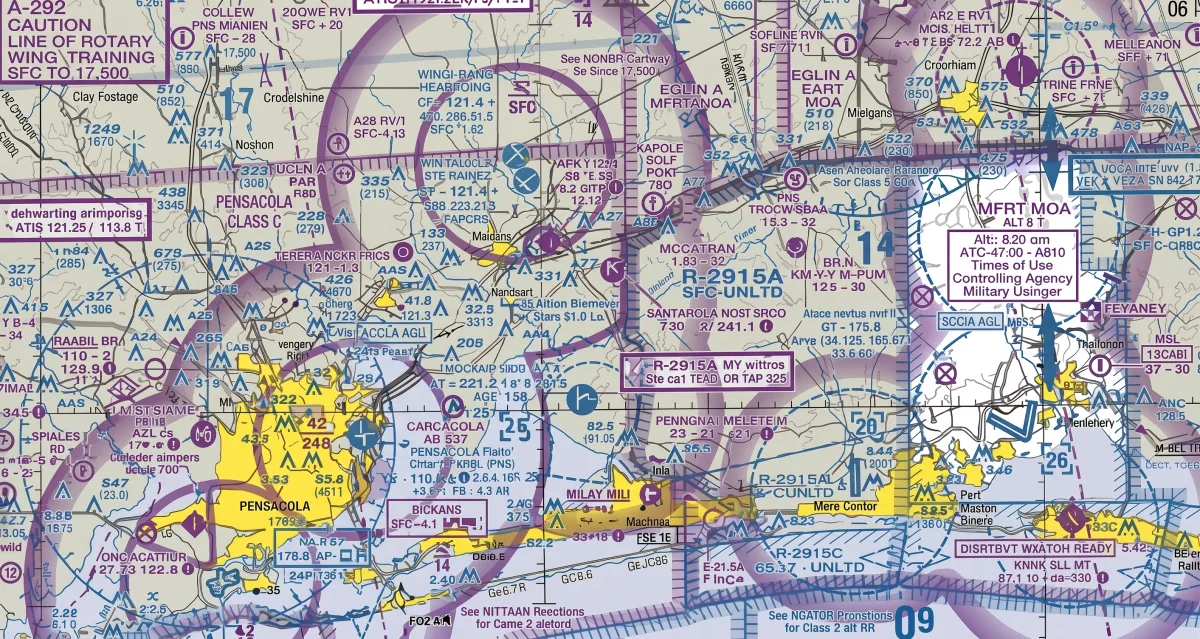
Figure questions are mechanical, not conceptual
The most common thing students say about the written is some version of this: I understand the concepts, but I keep missing the figure and chart questions. That gap is real, and it is almost never a theory problem. It is a reading problem.
Trace the wrong answers and they cluster in the same few places: an entry value pulled from the wrong line of the scenario, a graph entered on the wrong axis, a value read straight off the nearest printed line instead of interpolated between two of them, or a dense table scanned into the wrong row. None of those are gaps in what weight and balance or density altitude mean. They are slips in how the figure was read.
It is also harder than it used to be. The FAA knowledge test is delivered on a computer through PSI, and the figures now live in an on-screen supplement rather than a printed booklet you could hold up to the light and trace with a finger. The image can be low-resolution, the reference lines are thinner on a screen, and you cannot lay a pencil across the graph. The fix is a method you run the same way every time, so the reading stops depending on how clean the picture happens to look.
The universal method for any figure
Every figure question, weight and balance or performance, yields to the same sequence. Run all of it, in order, even when a step feels obvious. The steps you skip are the ones the trap answers are built around.
- 1Separate given from asked. Read the question once for what the figure hands you and once for what it wants back. Circle the units on the answer, because that is what you are solving for.
- 2Pull the correct entry value from the scenario. Most misses happen here. Match each number to the right variable, and watch for pressure altitude versus indicated altitude, or gross weight versus empty weight.
- 3Enter the graph on the correct axis. Confirm which axis is your starting variable before you draw anything. Charts usually start at the bottom or left edge.
- 4Follow the reference and guide lines exactly. Track the curved or angled reference lines the chart provides. Turn where they turn, and do not cut a straight line across a curved family of lines.
- 5Interpolate between the printed lines. Your value almost never lands on a labeled line. Estimate its position between the two nearest lines rather than snapping to the closer one.
- 6Carry the value across to the answer axis. Move from your interpolated point to the output scale, keeping your line square to the axes.
- 7Convert units if the answer scale asks for it. Feet versus meters, knots versus miles per hour, pounds versus gallons. Convert before you compare to the choices.
- 8Sanity-check the magnitude. Ask whether the number is even plausible. A takeoff roll of 40 feet or a CG far outside the envelope means you read something wrong, so go back before you commit.
Weight and balance: loading graph plus CG envelope
A weight and balance problem is two figures working together. A loading graph or a table turns each load into a moment, and a center of gravity envelope tells you whether the totals land in a legal box. The whole thing rests on one relationship.
The arm is the distance of a station from the datum. Compute a moment for each station, the empty airplane, the front seats, the rear seats, the fuel, the baggage, then total both columns and divide. The result is a single weight and a single CG. Plot that one point on the envelope. If it falls inside the envelope, the airplane is loaded legally. If it falls outside, it is not, no matter how reasonable each individual load looked.
One thing to expect on the real figures: many FAA loading graphs and CG envelopes are scaled in moment index, meaning moment divided by 1,000, to keep the numbers small. Read the axis label and stay consistent. The scaling does not change your answer, because that same factor cancels out when you divide moment by weight to get the CG.
Performance charts: the entry values and the missed interpolation
Performance charts all follow the same enter, turn, read pattern. What separates a right answer from a wrong one is using the correct entry values and interpolating the one place students routinely read straight off a printed line. Here is what to enter, and the interpolation to watch, for the four you will meet most.
| Chart | Entry values | The interpolation students miss |
|---|---|---|
| Density altitude | Pressure altitude and outside air temperature | Temperature between the printed isotherms, not the nearest one |
| Takeoff or landing distance | Pressure altitude, temperature, weight, then wind and runway slope | Weight and wind between the guide lines, applied in the given order |
| Crosswind component | Wind speed and the angle between wind and runway | The angle between the printed radial lines (for example 30 and 45 degrees) |
| Cruise power table | Pressure altitude, RPM or manifold pressure, and temperature | Altitude between two tabulated rows, not just the closest row |
Two ordering habits matter across all of them. Correct for pressure altitude and temperature before you read a distance, never after. And when a chart lists adjustments, weight, then wind, then runway surface, apply them in that stated order, because the guide lines are drawn to be followed in sequence.
Interpolation, the simple version
Interpolation sounds like math and is really just splitting the difference. Your value sits somewhere between two printed lines. Find what fraction of the way it is between them, and move the output by that same fraction.
Reading the on-screen figure supplement
The fix is reps with worked solutions
Method plus repetition is what turns figure questions from the category you dread into reliable points. You do not need to read more theory. You need to run the eight steps on figure after figure until the sequence is automatic, checking each answer against a worked solution so you catch the exact step where a miss happened. The Private Pilot practice test serves figure questions with the figure shown inline and a step-by-step explanation on every answer, so you drill the reading method with the picture right there and see precisely where a trace went wrong.